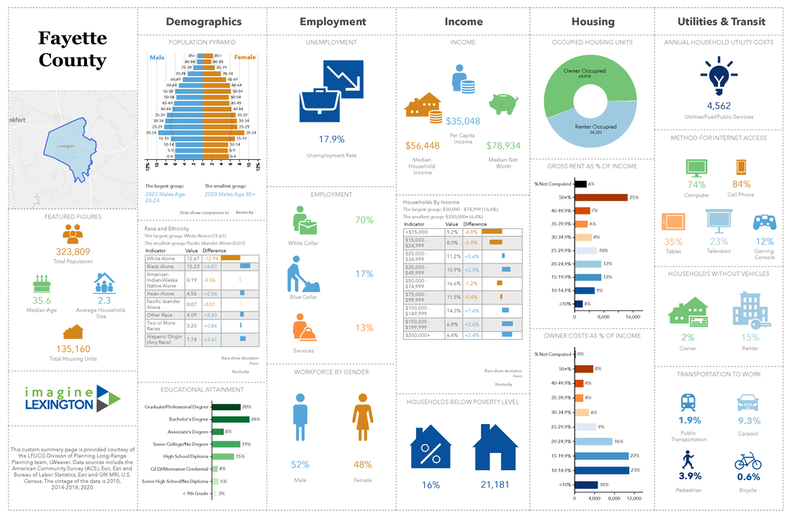
Fayette County Infographics
|
DISCIPLINES Geography Data Science Urban Planning Research Statistics Math |
OVERVIEW
In an ever-changing world inundated with information and data, visualizing figures helps us to better understand the fabric of our community. These infographics contain data estimates from authoritative data sources maintained by Esri demographers, statisticians, and economists. The downlaodable infographic pages that follow contain common and custom infographics at various geographic levels ranging from state to sub-county. If printing, the recommended size is a scaled down 11x17. Check out the video below for tips on understanding the data and an overview of the content.
|
Overview Presentation
This content was presented to the Planning Commission in September 2020.
|
Hard Skills
Visualization
Quantitative Analysis Statistical Analysis Data Validation Metadata Development Documentation |
Soft SkillsCommunication
Innovation Presentation Project Management Strategy |
These infographics were created by L Well. Weaver, Senior Planner at LFUCG. Reviews from LRP team members helped this product attain higher levels of value. The technical infrastructure and enthusiastic support from the LFUCG GIS team are critical for these products.
Production Date: 2020.09